About CheckMyBlob
CheckMyBlob is a machine learning system that can be used to identify ligands in unmodeled fragments of electron density maps or to validate existing models. The server processes PDB/mmCIF and MTZ files and returns a set of ligand predictions along with 3D visualizations of the detected electron density blobs. The server's predictions can be used to model ligands in the detected electron density fragments using Coot.
How to use the server?
Go to the main page, select your task (identify or validate ligands), upload your data, visualize and analyze the suggestions. Additionally, you can export the results to a script and model potential ligands directly in Coot. For a step by step tutorial take the Tour.
How does it work?
CheckMyBlob learns to generalize ligand descriptions from electron density maps and uses that knowledge to detect and identify ligands in previously unseen density. In the learning phase, uninterpreted blobs are first cut out from electron density maps generated using the polymer-only portions of PDB structures. Next, each blob is described by a set of numerical features, which are fed to a machine learning algorithm (classifier). The classifier automatically creates a function (classification model) that predicts the best ligand based on the blob’s numerical features. In the identification phase, this classification model is used to recognize ligands in previously unseen electron density maps.

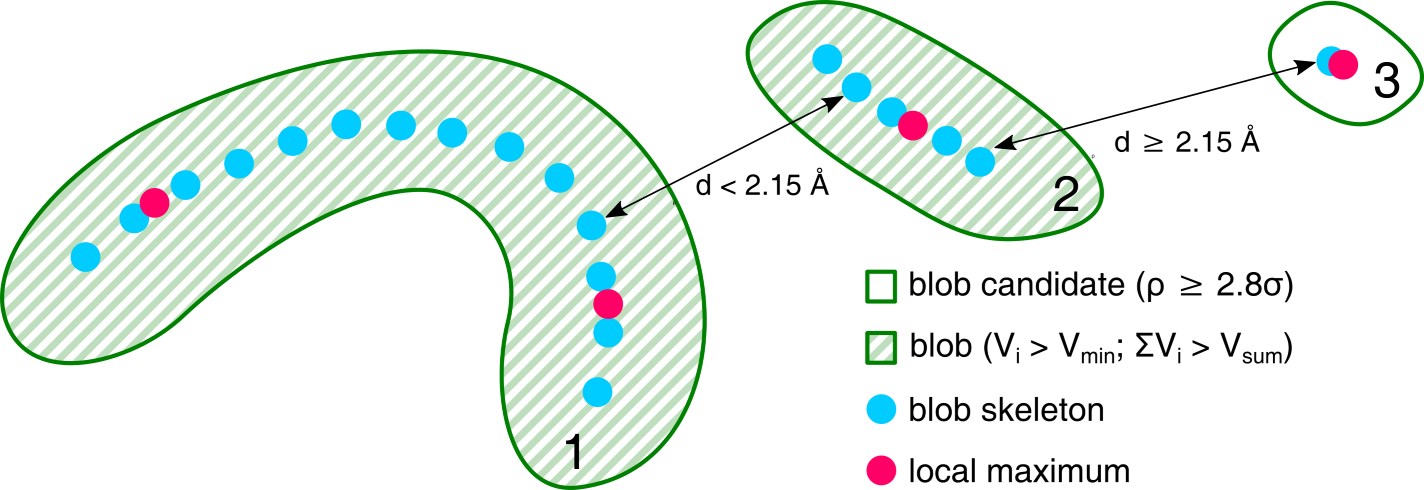
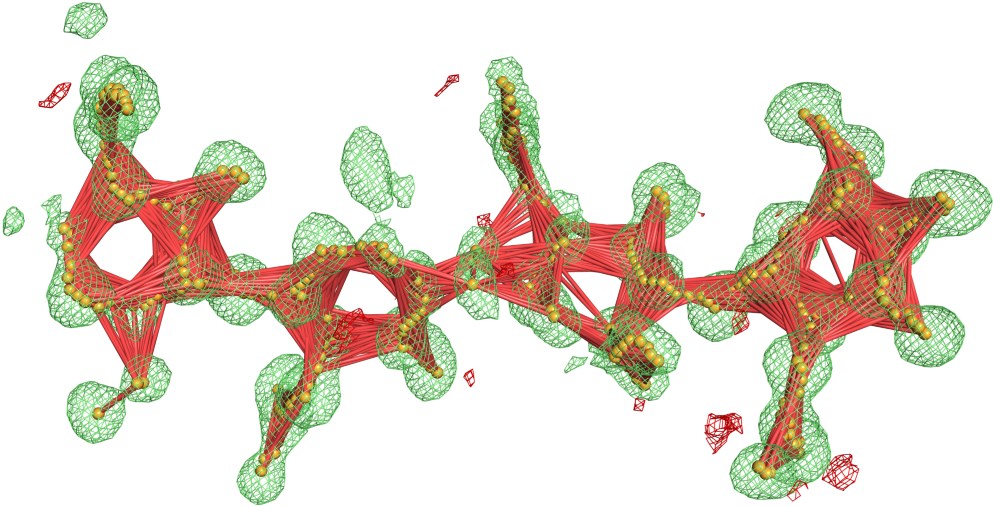
Blobs are automatically found by analyzing all positive electron density peaks within the Fo-Fc map. To mitigate the problem of ligands divided into multiple blobs, the system detects local maxima and skeletonizes the electron density within the isosurface of each blob, and combines adjacent blobs if the distance between the local maxima or skeleton nodes is less than 2.15 Å. Finally, any fragments of electron density in the blob isosurface that overlap with the isosurface of the modeled biopolymer atoms are cut out from the blob. In practice, CheckMyBlob is capable of detecting ligands consisting of tens of blob candidates.


How reliable is it?
In cross-validation experiments involving 696,887 ligand instances (see Ligands section), CheckMyBlob's top prediction was correct 71% of the time, whereas looking at the server's list of top-10 suggestions the correct ligand was within that list 95% of the time. On a separate test set of 17,150 ligands gathered after the training data were collected, the top-1 accuracy and top-10 accuracy were 59% and 93%, respectively. Nevertheless, CheckMyBlob learns ligand descriptions from existing PDB depositions. Even though the ligand instances used for training are selected based on several quality criteria, each CheckMyBlob prediction should be treated as a suggestion that needs further investigation. Moreover, CheckMyBlob's prediction is based solely on the electron density map, and the knowledge about all ligands that might be present in the crystal based on:
- crystallization conditions,
- protein buffer components,
- additional compounds added,
- compounds that might be retained during protein purification,
- and any potential chemical reactions in between,
The reliability of a concrete prediction can be gauged by the prediction's certainty (probability). Each server prediction is accompanied by a percentage probability of the server being right. The histogram and line plot below present how often the server was right for given certainty level, in terms of absolute and relative values. Both plots show that predictions with higher certainty are in fact very probable, whereas predictions with lower certainty values have a higher chance of being incorrect.
Finally, the reliability of CheckMyBlob's predictions is dictated by the popularity of a given ligand. The ligands that occur more often in the PDB, have more training data. Moreover, some ligands are primarly seen in large, low-resolution structures, where not all small-molecules are carefully modeled. As a result, less popular or low-quality ligands are not always CheckMyBlob's first pick. Below is CheckMyBlob's confusion matrix, which presents the error proportions of each pair of ligands. The matrix takes into account only CheckMyBlob's top suggestion. In most cases, even if the correct answer is not the top suggestion, it is within the list of 10 predictions provided by the server.
Credits and attributions
CCP4 is licensed under the CCP4 academic license. Collaborative Computational Project, Number 4 (1994) The CCP4 suite: programs for protein crystallography. Acta Cryst. D50, 760-763.
REFMAC is licensed under the CCP4 academic license. Murshudov, G. N., Vagin, A. A. & Dodson, E. J. (1997) Refinement of Macromolecular Structures by the Maximum-Likelihood Method. Acta Cryst. D53, 240-255.
NGL is licensed under the MIT license. Rose, A. S. & Hildebrand, P. W. (2015) NGL Viewer: a web application for molecular visualization. Nucl Acids Res. 43, W576-W579.
Bootstrap by Twitter is licensed under the MIT license.
jQuery is licensed under the MIT license.
Font Awesome is created by Dave Gandy and licensed under the SIL Open Font License.
Roboto, Roboto Mono, and Raleway are licensed under the SIL Open Font License.
Funding
The work was supported in part by the Polish National Agency for Academic Exchange under Grant No. PPN/BEK/2018/1/00058/U/00001 and by the National Institutes of Health under Grant No. GM132595.